

Forex charts are an integral tool for traders who want to analyze and make informed decisions about the market.
The market charts are used in determining the trend and direction of currency pairs over time, offering traders a visual representation of the market’s movements.
Nonetheless, for beginners, forex charts can be quite intimidating and confusing. This extensive guide will help in explaining how to read and analyze forex market charts and enable traders to make sense of the market’s movements.
Comprehending What Forex Charts Entail
Forex charts comprise two axes: the horizontal x-axis and the vertical y-axis. The y-axis represents the price of the currency pair while the x-axis represents time.
Traders and short-term investors use these market charts to identify patterns and trends that form in the market. Hence, they can predict the forex market’s future price movements letting them execute profitable trades.
Various types of forex charts are available. Nevertheless, the most commonly used are bar charts, line charts, and candlestick charts.
Line Charts
Line charts are the most basic type of forex charts. They accurately plot the closing price of a currency pair over time, joining the dots with a straight line.
Line charts are handy in the identification of market trends. Nevertheless, they do not offer advanced information when compared with other forex charts.
Bar Charts
Bar charts offer more extensive information than line charts. These forex charts plot the low, high, and closing prices in the market for a currency pair for a specific time. Every bar represents a particular period, 30 minutes, an hour, four hours, or a day.
Notably, the top of the bar represents the highest price while the bottom of the bar represents the lowest price the currency pair drops to. The horizontal lines on both sides of the bar represent the closing and opening prices.
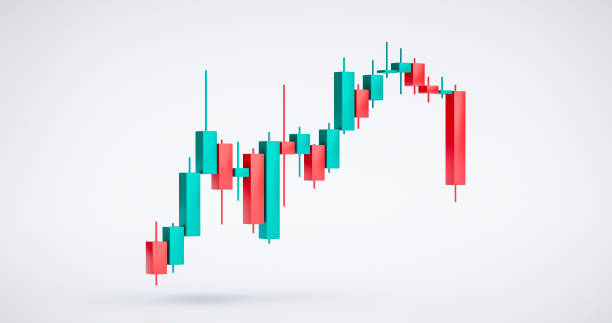
Candlestick Charts
Candlestick charts have become the most popular forex charts since they plot the low, high, and closing prices of currency market pairs for a particular time.
Every candlestick represents a particular period, such as an hour or a day. In that context, the body of the candlestick represents the closing and opening prices, while the wicks that form represent the low and high prices.
Candlestick charts are quite useful in the identification of patterns and trends that form in the market. They also offer extensive information about the market’s volatility, with longer wicks meaning that there is great volatility.
Analyzing Market Charts
To read and analyze forex charts, traders need to comprehend what various elements of the chart entail, including time, price, and indicators.
Market Price
The y-axis of any forex chart represents the price of the currency. Traders must understand the scale of the y-axis to ensure that they interpret the market chart precisely.
Notably, the scale can be logarithmic or linear, and the traders must know which one they will use to interpret the market chart correctly.
Time
The x-axis in any forex chart represents time. Traders have to pay attention to the time represented by every bar or candlestick.
For instance, a daily chart has one candlestick or bar representing each day, while an hourly chart has a bar representing every hour.
Indicators
Forex market charts can feature different indicators, like MACD, moving averages, and RSI. The indicators are mostly used in the identification of market patterns and trends, giving traders more information to make informed decisions.
For instance, moving averages represent the average price of a currency pair within a particular period. In most cases, the traders use moving averages to determine the trends in the market and find the best time to sell or buy a currency pair.
MACD identifies changes in momentum in the forex market. It is carefully calculated by subtracting the 26-day exponential moving average from the 12-day exponential moving average.
RSI identifies oversold and overbought conditions in the market. It determines the strength of a currency pair’s price action over a particular period.
The Takeaway
Analyzing forex charts is an integral skill for traders to make informed and educated decisions about the market. Traders have to understand the various types of charts available, including line charts, bar charts, and candlestick charts to determine what works best for them.